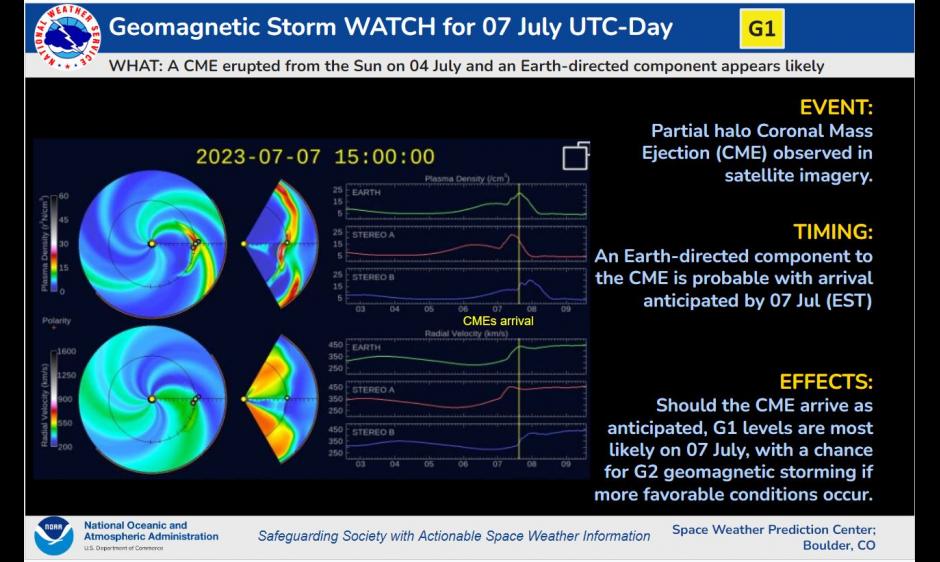
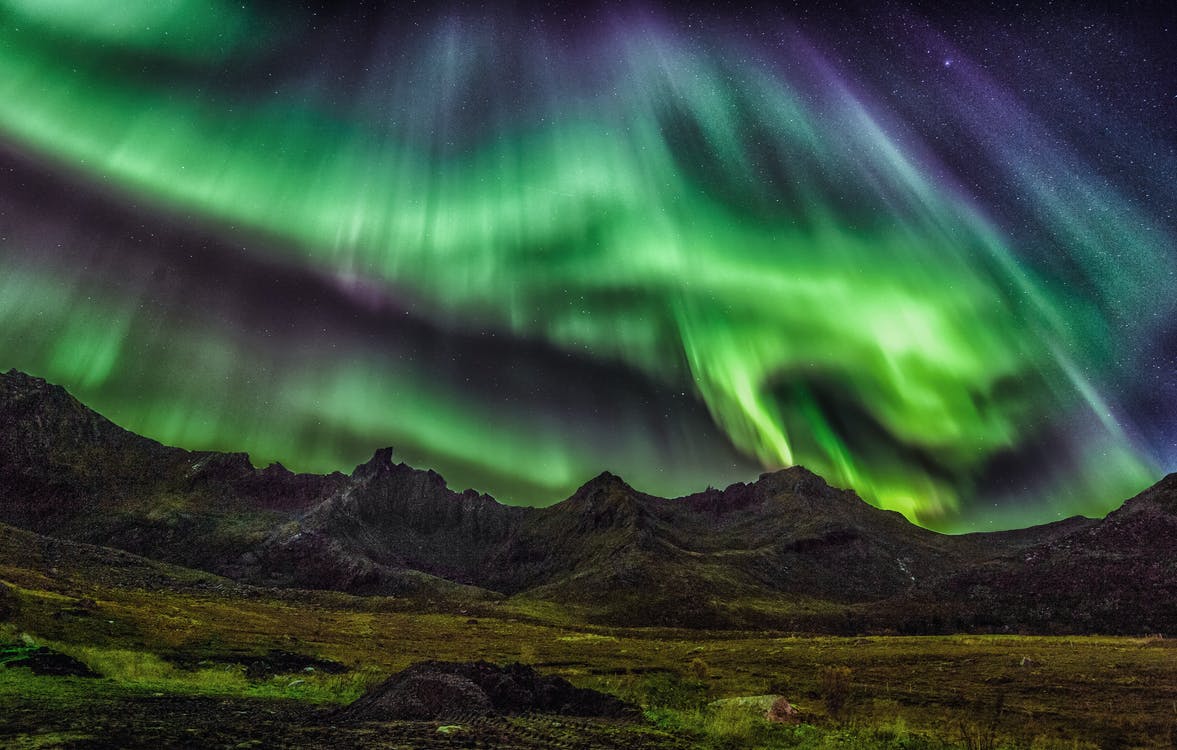
While the sky across America is filled with fireworks to celebrate Independence Day on July 4, the sun may be bringing another dazzling show of night-time colors through a display of aurora as a geomagnetic storm hits Earth. The National Weather Service’s Space Weather Prediction Center (SWPC) has issued a Geomagnetic Storm Watch for July 7 where G1 storm conditions are expected; forecasters warn that G2 conditions may be reached too.
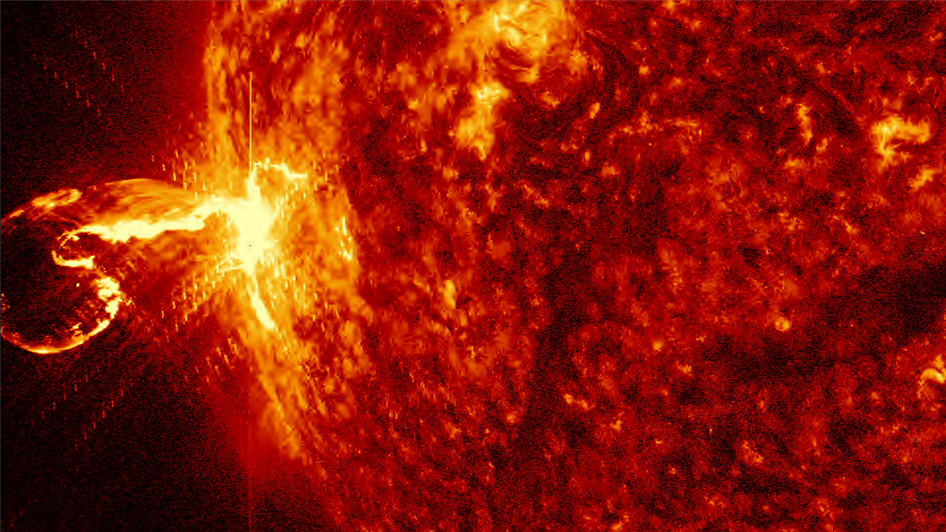
According to the SWPC, a partial halo Coronal Mass Ejection (CME) was observed in satellite imagery and an Earth-directed piece of this solar blast is due to arrive around July 7.
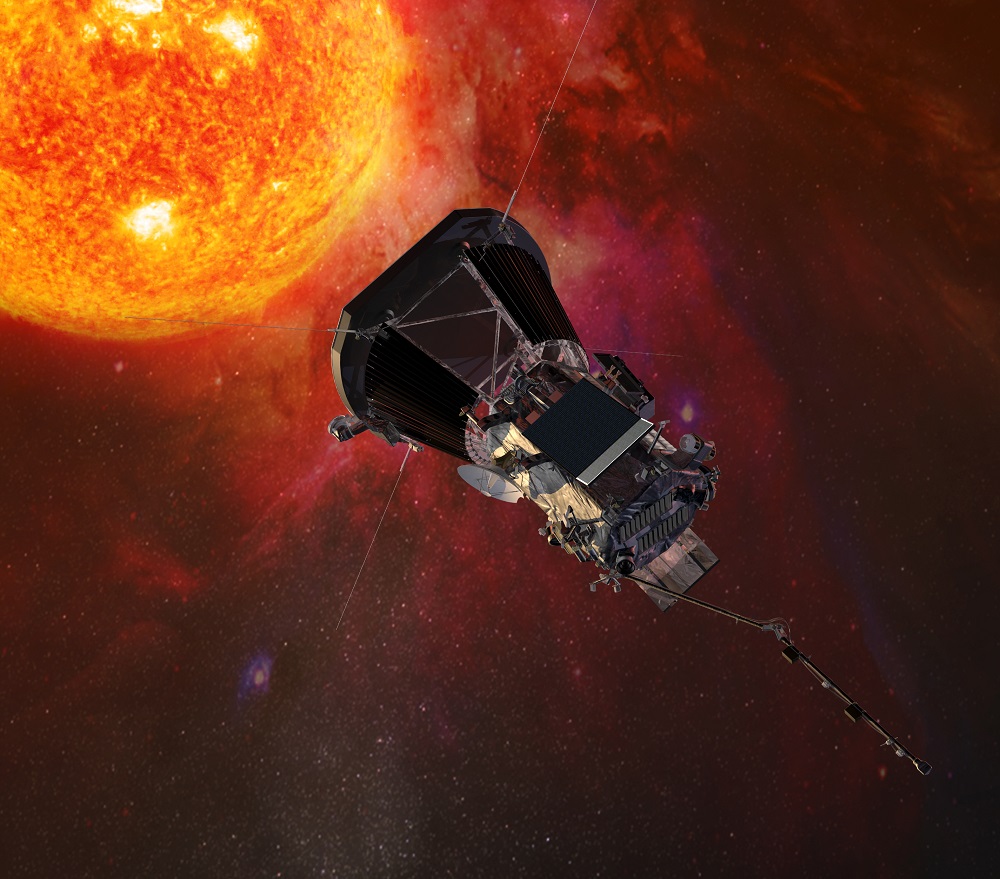
CMEs are large expulsions of plasma and magnetic field from the Sun’s corona. They can eject billions of tons of coronal material and carry an embedded magnetic field that is stronger than the background solar wind interplanetary magnetic field (IMF) strength. CMEs travel outward from the Sun at speeds ranging from slower than 250 kilometers per second (km/s) to as fast as near 3000 km/s. According to the SWPC, the fastest Earth-directed CMEs can reach Earth in as little as 15-18 hours while slower CMEs can take several days to arrive. They expand in size as they propagate away from the Sun and larger CMEs can reach a size comprising nearly a quarter of the space between Earth and the Sun by the time it reaches our planet. The arrival of a CME can create a fresh geomagnetic storm event upon impact.
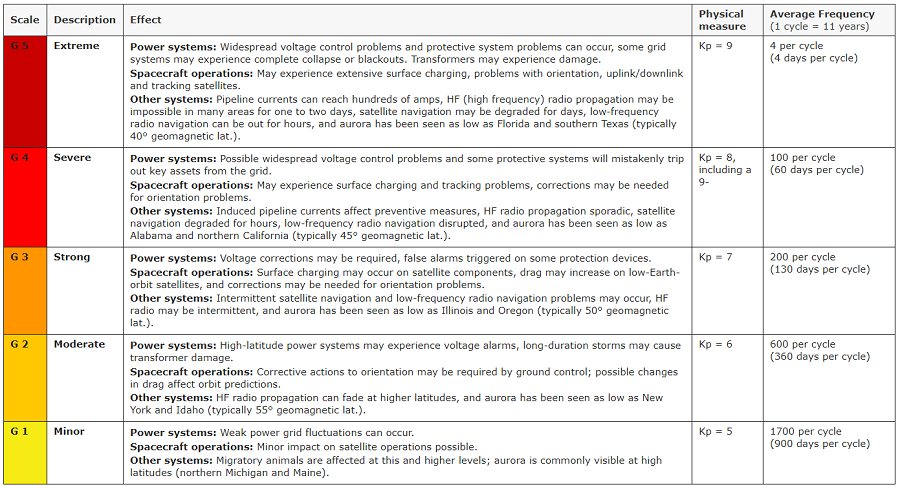
The SWPC says the area of primary impact will be poleward of 60 degrees Geomagnetic Latitude. In this region, power grid fluctuations can occur on Earth while in space, satellite orientation irregularities could occur. Communications can also be hampered: high frequency (HF) radio propagation can fade at higher latitudes. Elsewhere, Mother Nature may light up the skies more south than usual; aurora could be visible as low as Michigan to Maine.
The SWPC writes in their last outlook, “Magnetic responses are likely to reach the G1 (Minor) geomagnetic storm levels, with a chance for G2 storm levels if more favorable conditions are observed.” Geomagnetic storms are rated on a 1-5 scale with 1 being minor and 5 being extreme.
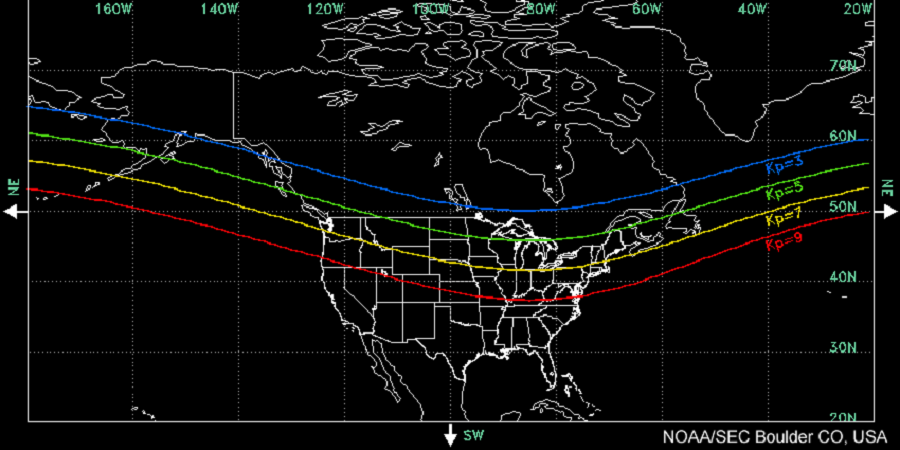
The K-index, and by extension the Planetary K-index, are used to characterize the magnitude of geomagnetic storms. The SWPC says that Kp is an excellent indicator of disturbances in the Earth’s magnetic field and is used by SWPC to decide whether geomagnetic alerts and warnings need to be issued for users who are affected by these disturbances. Beyond signifying how bad a geomagnetic storm’s impact can be felt, the Kp index can also help indicate how low the aurora will be.
Currently, the SWPC expects the KP index to be around 4.67 in the peak of the event late on July 7.
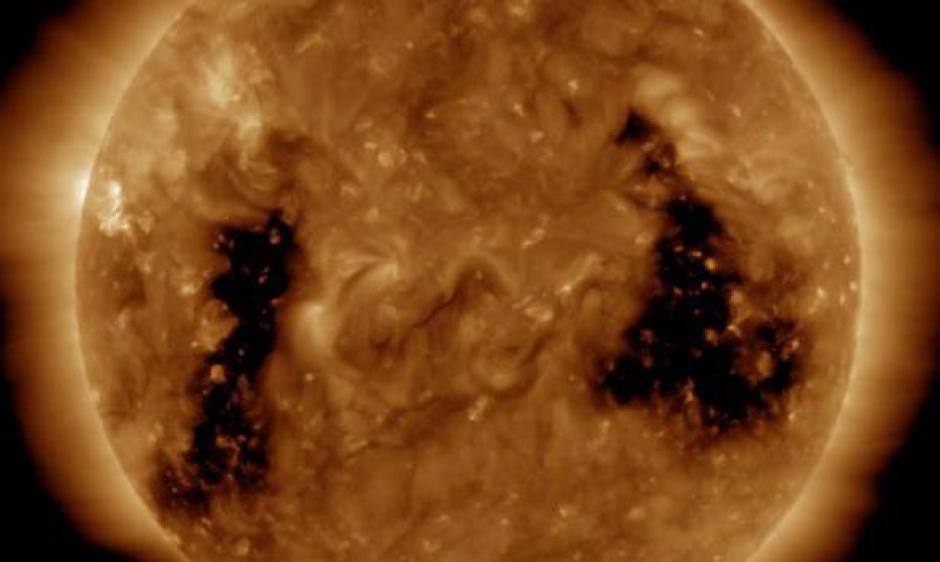
NOAA forecasters analyze a variety of solar data from spacecraft to determine what impacts a geomagnetic storm could produce. If Earth is experiencing the effects of a coronal hole and a coronal mass ejection is forecasted to impact Earth, the combined effects could result in a more significant impact and more intense geomagnetic storming.
Analyzing data from the DSCOVER and ACE satellite is one way forecasters can tell when the enhanced solar wind from a coronal hole is about to arrive at Earth. A few things they look for in the data to determine when the enhanced solar wind is arriving at Earth:
• Solar wind speed increases
• Temperature increases
• Particle density decreases
• Interplanetary magnetic field (IMF) strength increases
While these solar events can help illuminate the sky with stunning aurora, they can also do considerable harm to electronics, electrical grids, and satellite and radio communications.
The 1859 incident, which occurred on September 1-2 in 1859, is also known as the “Carrington Event.” This event unfolded as powerful geomagnetic storm struck Earth during Solar Cycle 10. A CME hit the Earth and induced the largest geomagnetic storm on record. The storm was so intense it created extremely bright, vivid aurora throughout the planet: people in California thought the sun rose early, people in the northeastern U.S. could read a newspaper at night from the aurora’s bright light, and people as far south as Hawaii and south-central Mexico could see the aurora in the sky.
The event severely damaged the limited electrical and communication lines that existed at that time; telegraph systems around the world failed, with some telegraph operators reporting they received electric shocks.
A June 2013 study by Lloyd’s of London and Atmospheric and Environmental Research (AER) in the U.S. showed that if the Carrington event happened in modern times, damages in the U.S. could exceed $2.6 trillion, roughly 15% of the nation’s annual GDP.
While typically known for their weather forecasts, the National Oceanic and Atmospheric Administration (NOAA) and its National Weather Service (NWS) is also responsible for “space weather.” While there are private companies and other agencies that monitor and forecast space weather, the official source for alerts and warnings of the space environment is the Space Weather Prediction Center (SWPC). The SWPC is located in Boulder, Colorado and is a service center of the NWS, which is part of NOAA. The Space Weather Prediction Center is also one of nine National Centers for Environmental Prediction (NCEP) as they monitor current space weather activity 24/7, 365 days a year.

Image: NASA/Mary Pat Hrybyk-Keith
