The Federal Emergency Management Agency (FEMA) has launched a new mapping tool that identifies high risk areas for 18 different natural hazards in the country. This new application offers data about expected annual losses, social vulnerabilities & community resilience.
According to FEMA, the new index is intended to help people better understand the natural hazard risk of their respective areas or communities. Intended users include planners and emergency managers at the local, regional, state and federal levels, as well as other decision makers and interested members of the general public. FEMA believes that with improved understanding of natural hazard risk, communities can take action to reduce it.
The natural hazards captured by this index include avalanche, coastal flooding, dangerous cold wave, drought, earthquake, hail, dangerous heat wave, hurricane, ice storm, landslide, lightning, riverine flooding, strong wind, tornado, tsunami, volcanic activity, wildfire, and hazardous winter weather.
The index and the interactive maps that are created by index data explore natural hazard exposure, natural hazard frequency, and historic loss. They also factor in social vulnerability, which is the susceptibility of social groups to the adverse impacts of natural hazards, including disproportionate death, injury, loss, or disruption of livelihood. Community resilience is also captured; this measures the ability of a community to prepare for anticipated natural hazards, adapt to changing conditions, and withstand and recover rapidly from disruptions.
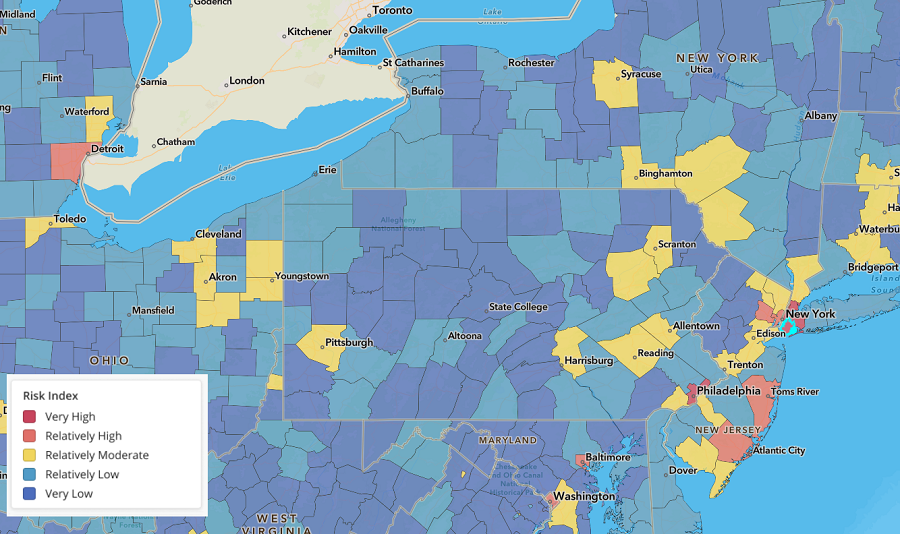
Maps and index scores reflect four categories from very high to very low; they are an overall National Risk Index, Expected Annual Loss, Social Vulnerability, and Community Resilience. Users can explore the data to determine how all of these factors influence the conditions of specific counties or census tracts across the United States, including Alaska and Hawaii. Assessments were not done for possessions such as Guam, Puerto Rico, and the U.S. Virgin Islands.
