While the Atlantic Hurricane Season is still months away with a June 1 start, meteorologists at the National Hurricane Center in Miami, Florida are busy updating products to keep people prepared and informed for the upcoming season. One of the most visible forecast product from the National Hurricane Center (NHC) is their forecast cone, and they’ll be showcasing two different ones this year. One, which was experimental last year, becomes operational this year, illustrating all land-based tropical storm and hurricane watches and warnings in effect for the continental U.S., Hawaii, Puerto Rico, and the U.S. Virgin Islands. The second offering is an experimental cone graphic which will better show the forecast track of a tropical cyclone using ellipses instead of circles to improve communicating accurate forecasts to the public.
After a successful test as an experimental product last year and the year before, the NHC will make last year’s experimental cone the actual cone for this year. This version of the cone graphic went through an experimental phase during the 2024 and 2025 hurricane seasons and replaces the version that only depicted coastal U.S. tropical storm and hurricane watches and warnings.
“User feedback showed strong support for the addition of inland watches and warnings. In addition, recommendations from social science research suggest that the addition of inland watches and warnings to the cone graphic helps communicate wind risk during tropical cyclone events while not overcomplicating the graphic with too many data layers,” said the NHC in a statement announcing the release of the final cone.
According to the NHC, the updated cone graphic will be available on hurricanes.gov for full and intermediate advisories when the full forecast advisory package is released. The NHC did say that in rare circumstances, a “preliminary” cone with only coastal U.S. watches and warnings could be posted until a final version with inland U.S. watches and warnings is available.
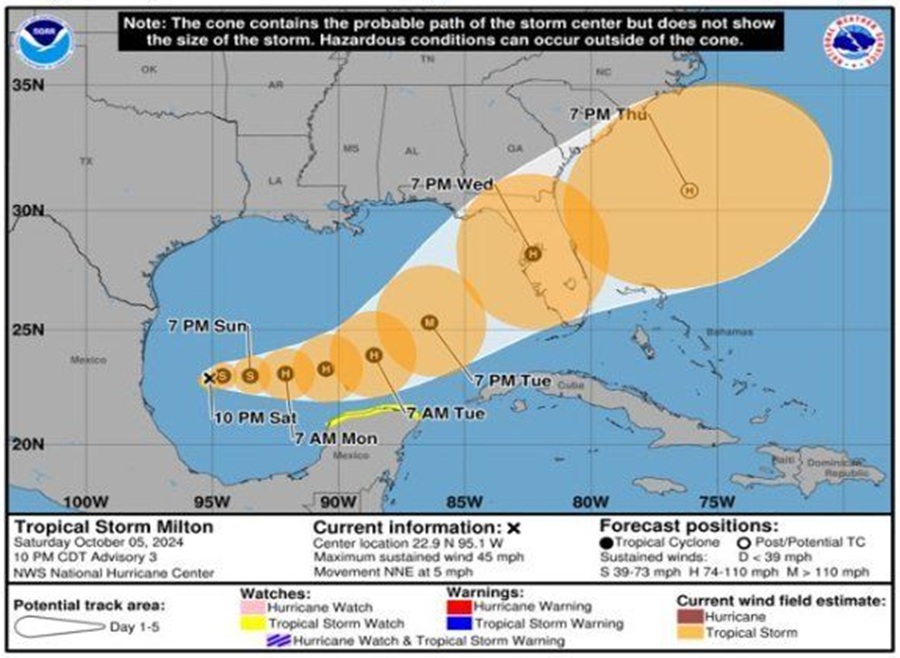
With the Cone Graphic with inland watches and warnings for the United States becoming operational in 2026, the NHC will be introducing a new experimental version of the track forecast cone. Since the debut of the National Hurricane Center’s Tropical Cyclone Track Forecast Cone in 2002, the cone has been constructed by drawing a line around circles anchored at each NHC forecast point. Absolute forecast track errors have been determined by calculating the distance between where the center of a tropical cyclone is forecast to be by NHC at a specified forecast time, and where it ends up at that time. Initially, the radii of the circles used to construct the cone were based on the average absolute error over the previous 10 years, but since 2007, the radii have been calculated using the 67th percentile of these absolute errors over the previous 5 years. In practice, this means that the center of the tropical cyclone would be expected to fall within each circle two-thirds of the time.

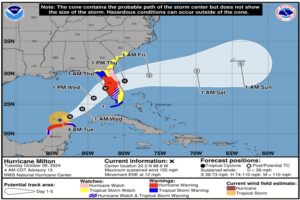
Starting this year, the NHC will experiment by changing two aspects of the cone; first, ellipses will be used instead of circles to account for along- and cross- track errors. Second, the NHC will use the 90th percentile of the along- and cross- track errors.
The experimental cone will be constructed by drawing a line around ellipses anchored at each NHC forecast point. Along-track errors are determined by calculating how far the center of a tropical cyclone ends up faster than or slower than the NHC forecast. Cross-track errors are determined by calculating how far the center of a tropical cyclone deviates to the left or right of the NHC track forecast. The “radii” (or more technically, the semi-major and semi-minor axes) of the ellipses are based on the “90th percentile” of NHC’s along- and cross-track errors over the previous 5 years. In practice, this means that the center of a tropical cyclone would be expected to fall within each ellipse 90% of the time.
The NHC says that the experimental cone will be released shortly after the advisory in the upcoming season. During the experimental phase, technical issues could arise and affect the timeliness or availability of the graphic.
