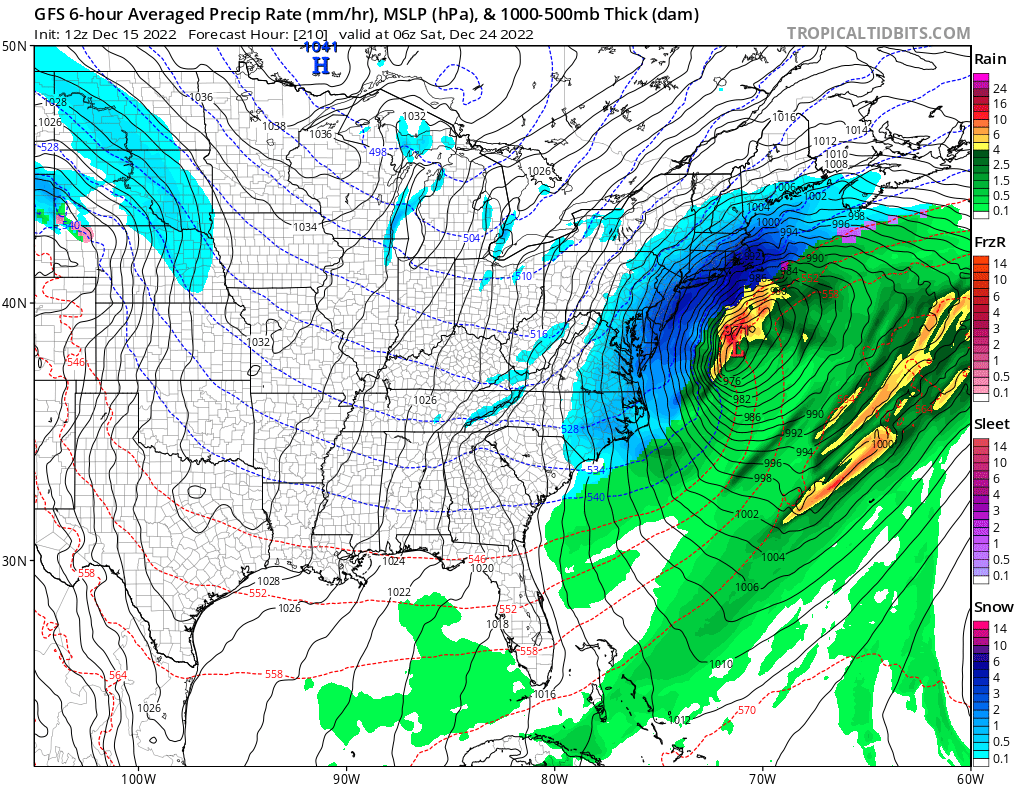
While many people may be dreaming of a White Christmas, some computer forecasts are also suggesting such a “dream” scenario too. Two of the world’s most impressive global computer forecast systems are somewhat aligned around the idea that an area of low pressure will take shape in the eastern United States and move up the northeast coast, bringing snow and cold to even the Atlantic coast in parts of the central and southern Mid Atlantic around Christmas Eve. If such a forecast solution were to verify, the cities along the I-95 corridor could see more than 5″ of snow from Washington, DC northeast to Boston, MA, with perhaps many more inches of snow possible beyond that.
The GFS and ECMWF are among many computer models meteorologists use to assist in weather forecasting. While meteorologists have many tools at their disposal to create weather forecasts, two primary global forecast models they do use are the ECMWF from Europe and the GFS from the United States. While the models share a lot of the same initial data, they differ with how they digest that data and compute possible outcomes. One is better than the other in some scenarios, while the opposite is true in others. No model is “right” all the time. Beyond the ECMWF and GFS models, there are numerous other models from other countries, other academic institutions, and private industry that are also considered when making a forecast.
At this time, both the GFS and ECMWF forecast models show the pre-Christmas low coming together in just over a week from now. Forecast model accuracy gets better within 10 days; beyond 10 days, accuracy isn’t great. But inside 10 days, and especially inside 5 days, model accuracy and performance improve. Because we are within 10 days to Christmas and because both models are suggesting similar solutions, confidence is growing in the meteorological community that this storm will take shape. While there is model agreement and some run to run consistency with their output, it is still too early to lock in any one forecast storm track, intensity, and precipitation types and amounts. Getting into such forecast specifics will likely come early next week in the days leading up to Christmas weekend.

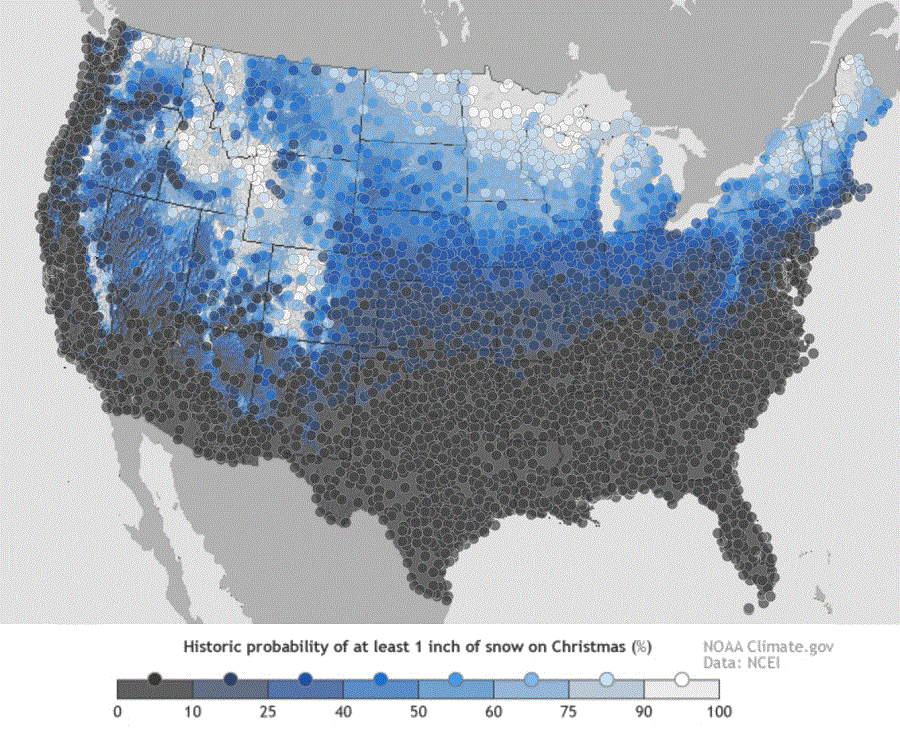
Source: National Oceanic and Atmospheric Administration (NOAA), Oceanic and Atmospheric Research (OAR), Climate Program Office (CPO), Climate.gov; NOAA National Centers for Environmental Information (NCEI)
While some may be dreaming for a white Christmas, many are wondering if their dreams will turn into forecast reality. Beyond what the forecast guidance is suggesting will unfold later this week, one can also look to climatological norms to see how likely snow for Christmas is in any given area.
The map here shows the historic probability of there being at least 1 inch of snow on the ground in the Lower 48 states on December 25 based on the latest (1981-2010) US Climate Normals from NOAA’s National Centers for Environmental Information (NCEI).
The 1981–2010 Climate Normals are the latest three-decade averages of several climatological measurements. This collection contains daily and monthly normals of temperature, precipitation, snowfall, heating and cooling degree days, frost/freeze dates, and growing-degree days calculated from observations at approximately 9,800 stations operated by NOAA’s National Weather Service (NWS).
While the map shows the historical probability that a snow depth of at least one inch will be observed on December 25, the actual conditions in any year likely vary from the norm. Different weather patterns and storm systems each December set the stage for whether or not there will be snow on the ground for Christmas Day.
It looks like the weather could be especially interesting in the days leading to Christmas in the eastern U.S.#ChristmasEveBlizzard? pic.twitter.com/H0xB5NgH82
— the Weatherboy (@theWeatherboy) December 15, 2022